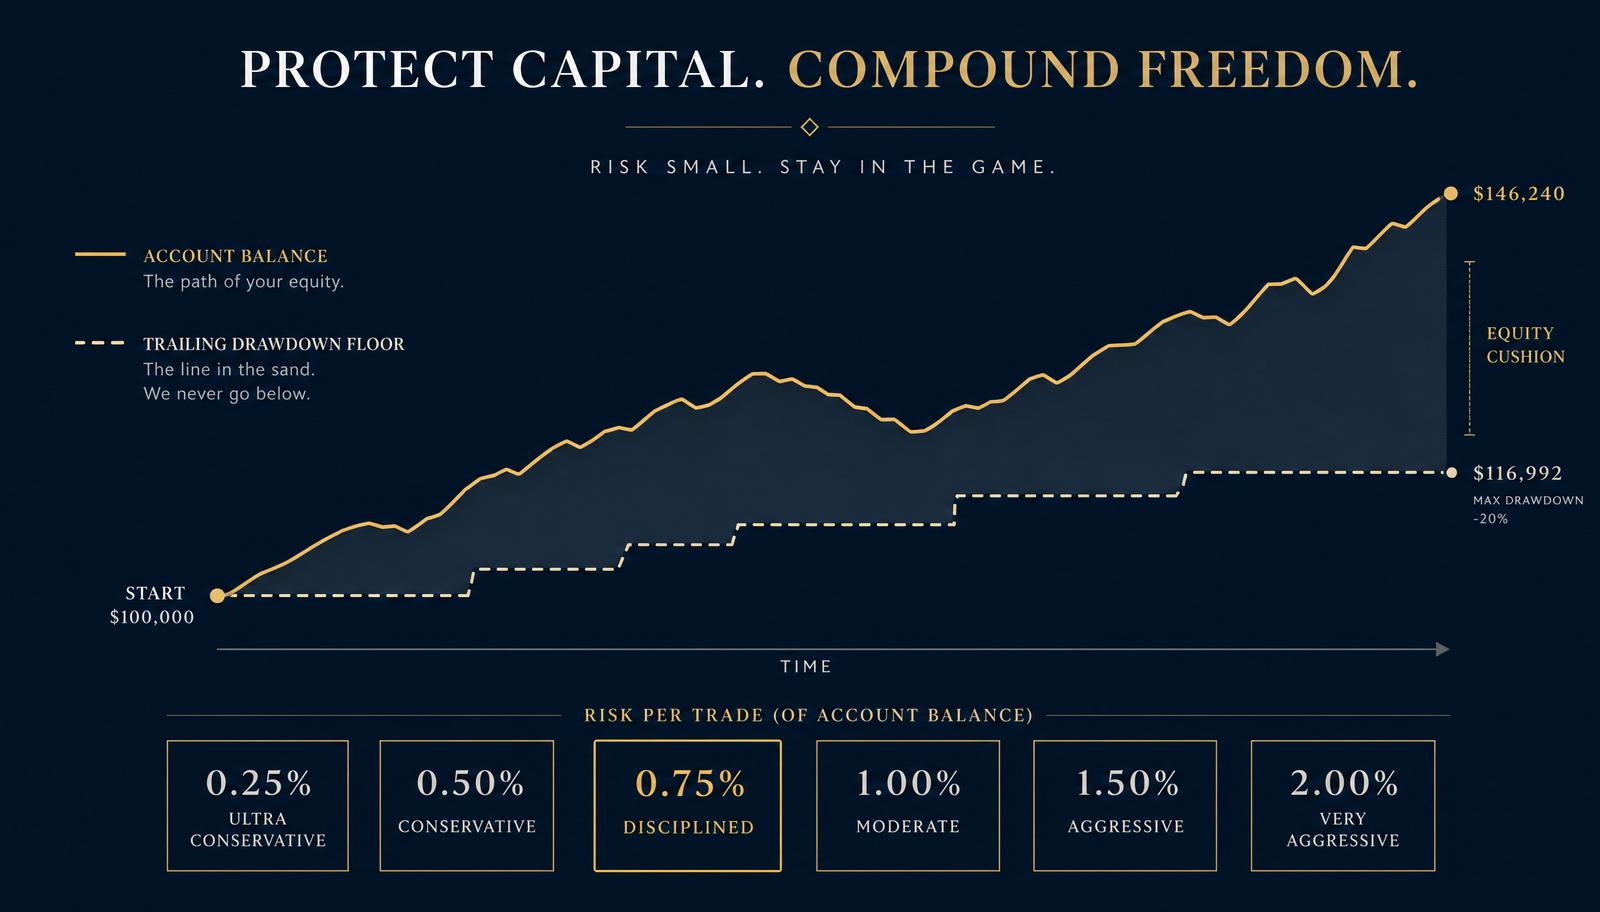
Most traders pick a risk percentage based on how fast they want to hit the profit target. That's backwards. On a funded evaluation, the constraint is the trailing drawdown floor — not the profit target. The math below shows why 0.5% is the setting that maximizes pass probability on almost every 50K evaluation.
The two numbers that matter
A typical 50K evaluation: $3,000 profit target, $2,000 trailing drawdown. The drawdown is the killer because it trails your peak equity. Push to $52,500 and your floor jumps to $50,500 — a single $1,500 losing session breaches.
1% risk — the naive default
At 1% ($500 per trade), a three-loss streak is $1,500 — 75% of your drawdown, from a totally normal variance sample. On a 55% strategy the probability of a 3-loss streak in the first 20 trades is roughly 33%. One in three challenges dies to normal variance.
0.5% risk — the disciplined setting
At 0.5% ($250 per trade), the same three-loss streak costs $750 — 37% of the drawdown. To breach the trailing floor from a peak, you'd need roughly six consecutive losses on 0.5% before recovery. On a 55% strategy that's a 1-in-140 event over 20 trades.
The compounding trade-off
Yes, 0.5% takes longer to hit target. On a 1.8R average, you need about 32 winners at 55% to reach $3,000 — roughly 60 trades. At two A+ setups per day, that's a month. That's a feature, not a bug: the evaluation is designed to punish speed and reward consistency.
Position sizing table
- — 0.5% on 50K = $250 risk = 12 NQ points on 1 contract, or 1 point on 12 MNQ.
- — 0.5% on 100K = $500 risk = 25 NQ points on 1 contract, or 2 points on 12 MNQ.
- — 0.5% on 25K = $125 risk = 6 NQ points on 1 contract, or 1 point on 6 MNQ.
When to consider 1%
Only after you've built a $1,500+ buffer above the trailing floor and only on A+ setups (Silver Bullet + Unicorn overlap). Never at the start of the evaluation. Never after a losing session.
Test the math on your own strategy
Run 30 replay sessions in the built-in 50K Challenge mode at 0.5% risk. Track how often you'd have breached the trailing floor. The number will convince you faster than any spreadsheet.